The latest from the CBS News Election & Survey Unit
Watch this space for a recap of the latest polls and data-driven studies curated by the CBS News Election & Survey Unit!
6/26/2019: The First Democratic Debates: What do Voters want to Hear?
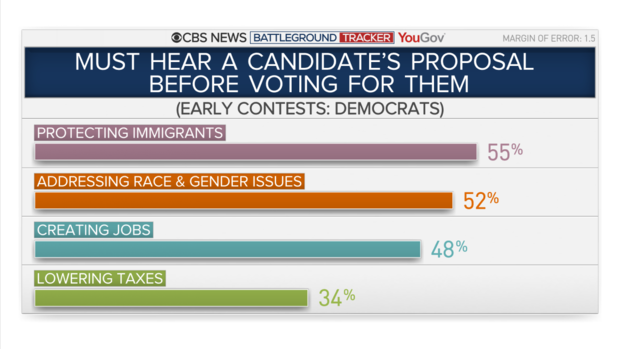
Ahead of the first debates of the 2020 campaign, we took a dive into the latest CBS News Battleground Tracker to see what voters say they must hear from a Democratic candidate before deciding to vote for them.
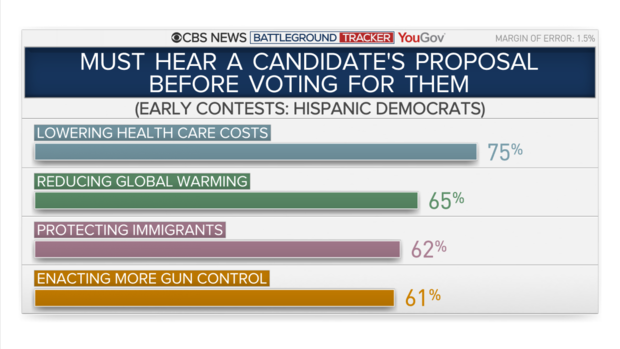
Health care is on top of voters’ minds. Three in four Democrats in states holding early nomination contests say they must hear a candidate’s proposal for lowering health care costs – the highest of any issue asked about in the poll.
A candidate’s plans for reducing global warming, protecting abortion rights and enacting more gun control are also high priorities for Democrats.
And more than half of Democrats in these states say they must hear a candidate’s plan to protect immigrants and their families and want to hear how they will address race and gender issues. Other economic issues like creating jobs and lowering taxes rank a bit lower. Although those who rate the state of economy negatively (about four in 10 Democrats) are more likely than those who have a positive view of it to want to hear a candidate’s plan for job creation.
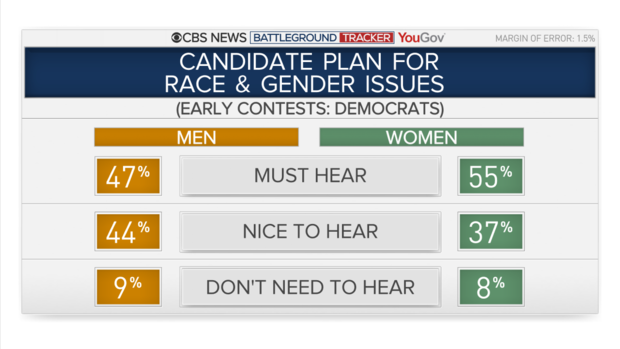
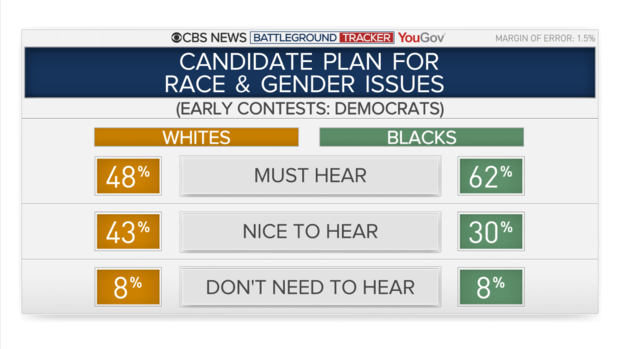
There are issues more important to hear about for some segments of the Democratic electorate than others. Hearing how a candidate plans to address issues of race and gender issues are particularly important to women and African American voters, as well as those who are “very liberal”. Most Democrats in these early states consider themselves liberal, including about a third who call themselves very liberal.
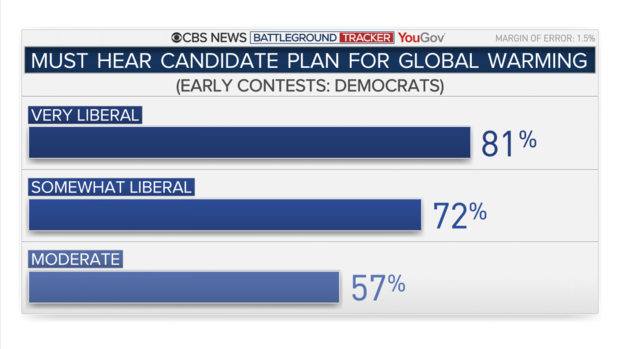
A candidate’s plan for global warming is especially important to the more liberal faction of these Democratic voters. Protecting immigrants and their families is also more of a priority among “very liberal” Democrats, compared to those calling themselves “somewhat” liberal or moderate.
Overall, moderates are less likely than liberals to say they “must hear” about a candidate’s position on these issues before voting for them, but lowering health care costs is the proposal they want to hear most about.
Hispanic Democrats (62%) are more likely than Democrats overall (55%) to want to hear a candidate’s proposal for protecting immigrants and their families, but lowering health care costs ranks highest for them, like most Democrats in these early states.
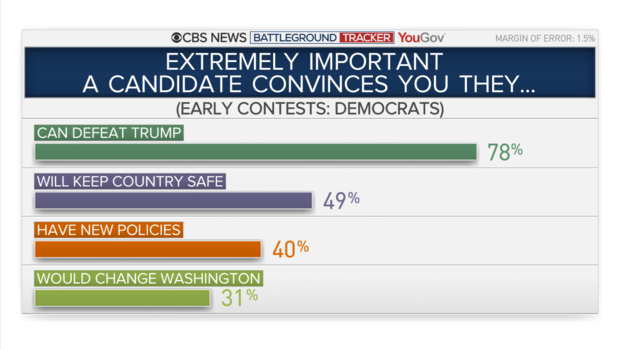
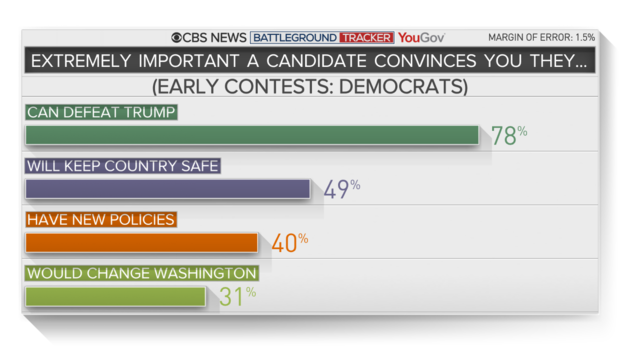
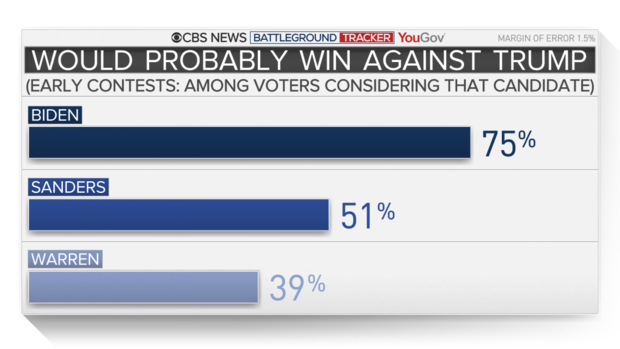
Still, Democrats really want someone who can win in November 2020. While they want to hear about the candidates’ policies, nearly eight in 10 say it’s extremely important that a candidate convinces them they can beat Donald Trump – the most important thing a candidate can do to earn their support. It outranks someone who can keep the country safe, having new policy ideas and someone who would change Washington. –by Jennifer De Pinto
———————————————————————————————————————-
This CBS News Survey is conducted by YouGov between May 31 and June 12, 2019. A representative sample of 16,624 registered voters in 18 states expected to hold early primaries and caucuses (Alabama, Arkansas, California, Colorado, Georgia, Iowa, Massachusetts, Minnesota, Nevada, New Hampshire, North Carolina, Oklahoma, South Carolina, Tennessee, Texas, Utah, Vermont, Virginia) was selected. This sample includes 7,885 self-identified Democrats and Democratic-leaning Independents. This sample was weighted according to gender, age, race, and education based on the American Community Survey, conducted by the U.S. Bureau of the Census, as well as 2016 presidential vote. The margin of error is approximately 1.5%.
6/21/2019: The First Day of Summer
Some polling about summer travel on the first day of the season…
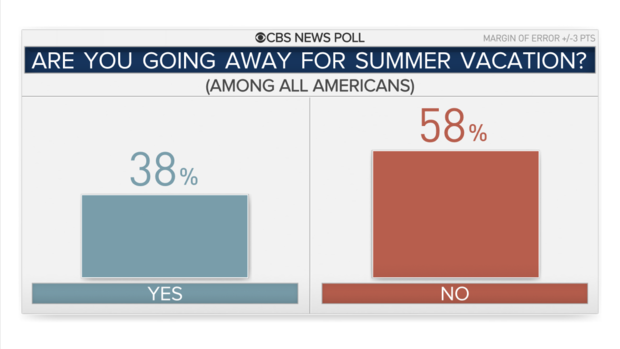
Summer may be upon us, but most Americans are not planning to go away for summer vacation this year. While 38% of Americans say they will be going away for summer vacation, 58% will be staying put.
Most who are traveling will be traveling 500 miles or more, including more than a third that will be traveling at least 1000 miles.
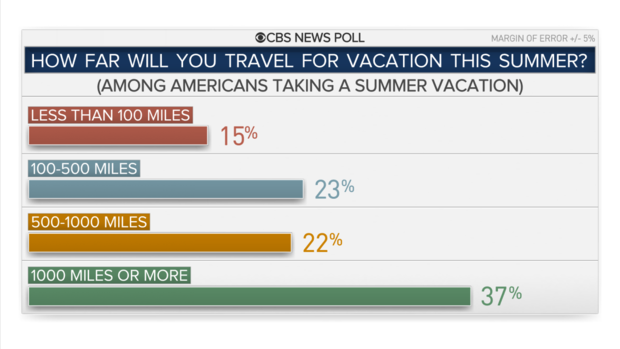
Income makes a difference both in whether or not one is traveling for summer vacation, and how far they go. Most Americans earning under $100,000 a year aren’t going away for summer vacation. Most earning more will be going away, including more than a third that will be traveling 500 miles or more. – Fred Backus
——————————————————————————————————————————-
This poll was conducted by telephone June 11-16, 2019 among a random sample of 1,012 adults nationwide. Data collection was conducted on behalf of CBS News by SSRS of Glen Mills, PA. Phone numbers were dialed from samples of both standard land-line and cell phones.
The poll employed a random digit dial methodology. For the landline sample, a respondent was randomly selected from all adults in the household. For the cell sample, interviews were conducted with the person who answered the phone.
Interviews were conducted in English and Spanish using live interviewers. The data have been weighted to reflect U.S. Census figures on demographic variables. The error due to sampling for results based on the entire sample could be plus or minus three percentage points. The error for subgroups may be higher and is available by request. The margin of error includes the effects of standard weighting procedures which enlarge sampling error slightly. This poll release conforms to the Standards of Disclosure of the National Council on Public Polls.
6/20/2019: The Democratic Primary – Divisions Emerge Along Generational Lines
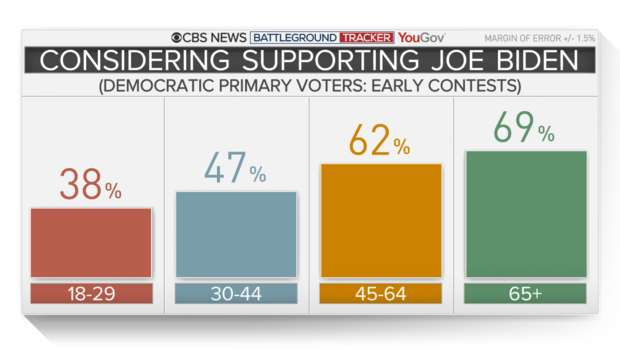
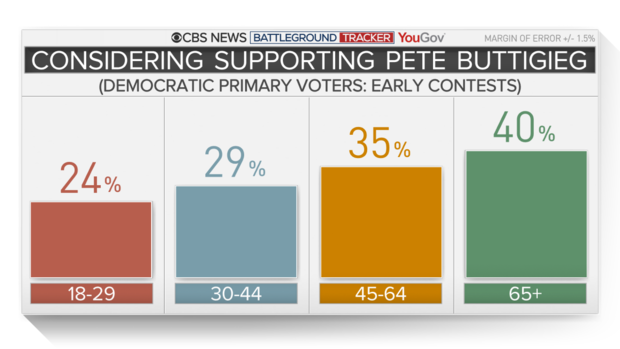
According to the latest CBS News Battleground Tracker of Democratic voters in early primary contests, most Democratic primary voters under the age of 45 want Democrats to advance a more progressive agenda than the country had under Barack Obama, while most older voters want the Democrats to return the country to the way it was before Donald Trump took office. Not surprisingly, they differ on which candidates they are considering voting for.
A large majority of Democratic voters over 45 are considering Joe Biden – more so than any other candidate – and this is particularly true of those 65 and older (69%). Support for Biden drops off among younger voters, however. 47% of those between 30 and 44 would consider voting for Biden, but this is true of just 38% of early Democratic voters under 30.
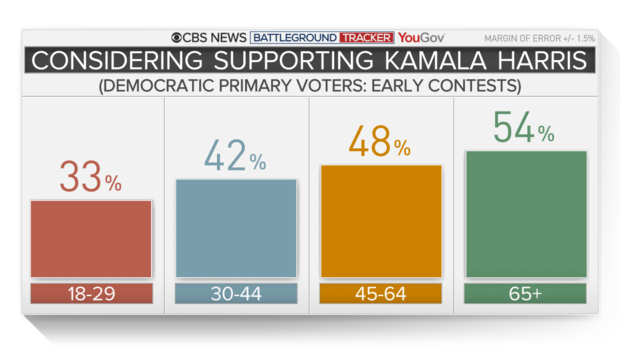
A similar pattern can be seen for Kamala Harris: she is being considered by more older voters than younger ones. 54% of early Democratic voters 65 and older say they are considering her, but she is being considered by just 33% who are under 30.
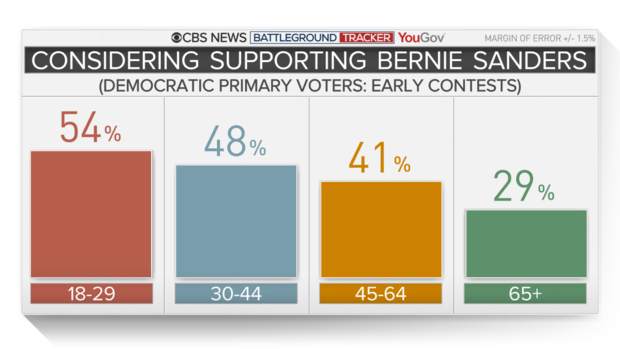
For Bernie Sanders, the trend is in the opposite direction. Most voters under 30 (54%) are considering voting for Sanders – more than any other candidate – and most cite his 2016 run as the reason why. But just 41% of those between 45 and 64 are considering voting for him. Among voters 65 and older, this drops to just 29%.
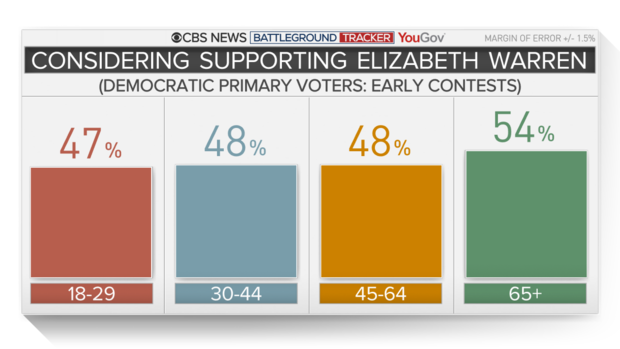
Though she isn’t the first choice of any one age group, interest Elizabeth Warren’s candidacy is the most consistent. About half of early Democratic voters of all ages are considering her; she is the only candidate for whom this is true.
One thing each age group does share is a conviction that age isn’t important. Majorities of all ages say that it doesn’t matter if the candidate is younger or older. Which candidates are being considered by which age groups seems to bear that out. At age 77, Bernie Sanders is the oldest candidate in the race, yet his strongest support comes from voters under 30. At age 37, Pete Buttigieg is the youngest candidate in the race, and yet Americans over 65 are the age group most likely to be considering him.– Fred Backus
6/16/2019: Electability – Democrats Want it but What is It?
Electability is the attribute Democrats are most looking for in a candidate, according to the latest CBS News Battleground Tracker. Nearly eight in 10 Democrats in states expected to hold early nominating contests say it’s extremely important that a candidate convinces them they can beat Donald Trump – the most important thing a candidate can do to earn their support. It outranks someone who can keep the country safe, having new policy ideas and someone who would change Washington.
Democratic voters want someone who is electable but what does electability mean to them? Motivating Democrats to come out and vote and having a candidate well-known to in national politics are things Democrats in these states think are necessary to win in 2020.
When asked what they think makes a Democratic candidate electable in November 2020, by a wide margin, most (67%) say it’s someone who can motivate Democrats who stayed home in 2016 rather than someone who will persuade Trump voters to vote Democratic in 2020 (33%).
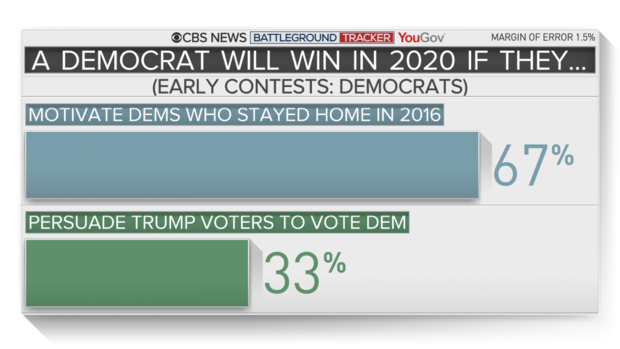
Joe Biden’s backers are a bit more likely than those supporting Elizabeth Warren or Bernie Sanders to say that a candidate needs to win over some 2016 Trump supporters, but a majority of them still see motivating Democrats to come out and vote as what will make a Democrat electable in 2020.
Most Democrats also think having a nominee well-known in national politics will help them win the general election. 74% say it’s best to have a candidate who is well-known; just 26% think it’s best to have someone new to national politics.
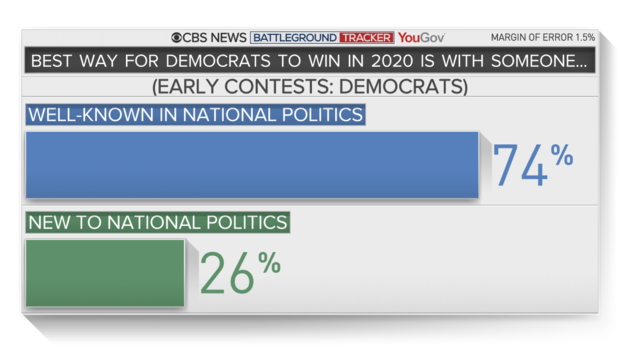
This helps bolster Biden. He performs particularly well among the majority who want a nationally known politically figure, while Buttigieg, who is Mayor of South Bend, Indiana is preferred among the smaller group of voters seeking someone new to national politics.
And when assessing a candidate’s chances to win in 2020. Seventy-five of those considering supporting Biden think he probably would beat Mr. Trump, a far higher number for Biden than among those considering other candidates.
Democrats and Swing Voters
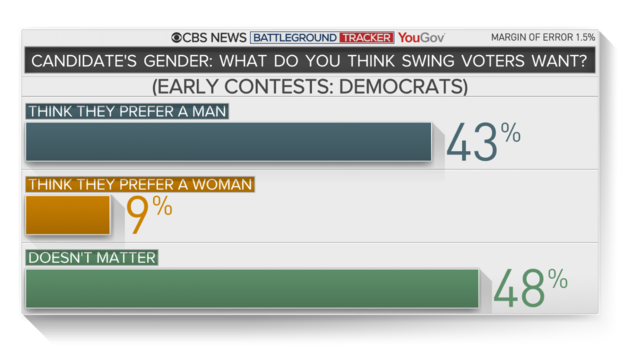
Generally, majorities Democrats in these early states say a candidate’s race, gender, or where they are from doesn’t matter to them. But these voters do think these traits matter more to swing voters – a group that candidates will be making a play for in the general election.
Democrats believe swing voters, for which gender and race matter, would prefer a man over a woman, and a white candidate over a person of color.
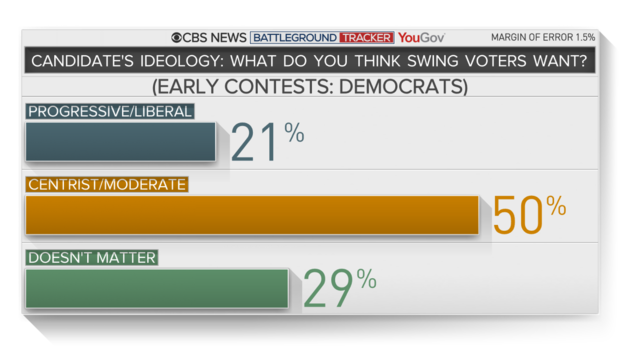
Most Democrats do say a candidate’s ideology matters both to themselves as well as to swing voters.
In recent years, Democrats have been more likely to identify as liberal than moderate and this is reflected in what Democrats in these early voting states are looking for in a candidate. 45% prefer a progressive or liberal candidate to a centrist or a moderate one (27%). Another 28% say it doesn’t matter to them.
But these Democrats think swing voters would prefer a centrist over a progressive. – by Jennifer De Pinto
More here:
====================================================================
This CBS News survey is conducted by YouGov between May 31 – June 12, 2019. A representative sample of 16,624 registered voters in 18 states expected to hold early primaries and caucuses (Alabama, Arkansas, California, Colorado, Georgia, Iowa, Massachusetts, Minnesota, Nevada, New Hampshire, North Carolina, Oklahoma, South Carolina, Tennessee, Texas, Utah, Vermont, Virginia) was selected. This sample includes 7,885 self-identified Democrats and Democratic-leaning Independents. This sample was weighted according to gender, age, race, and education based on the American Community Survey, conducted by the U.S. Bureau of the Census, as well as 2016 Presidential vote. The margin of is approximately 1.5%.
6/14/2019: A couple of tidbits ahead of Father’s Day
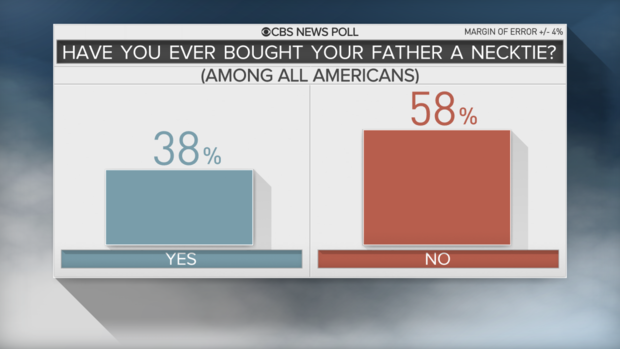
Most Americans Have Never Bought their Father a Tie
Though it may be the most iconic Father’s Day gift, it turns out that most Americans have never bought their father a necktie. While 38% of Americans have bought their father a tie at some point in their lives, 58% have not. Women (42%) are more likely to have bought their father a tie than men (34%), however.
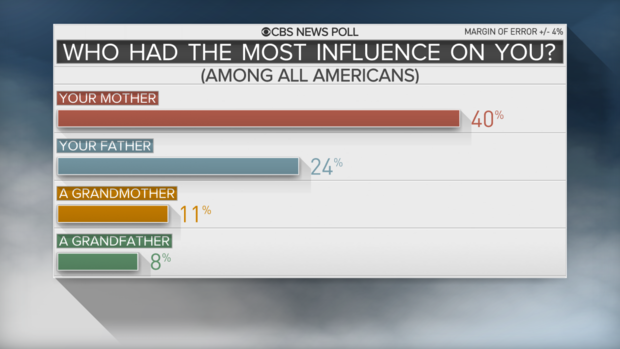
More Americans Say Mom Has Had More Influence on their Lives than Dad
When asked which family has had the most influence on the person they are today, Americans pick Mom over Dad. 40% say their mother has had the most influence, while just 24% pick their father. Even fewer pick a grandmother (11%), a grandfather (8%), or a sibling (3%).
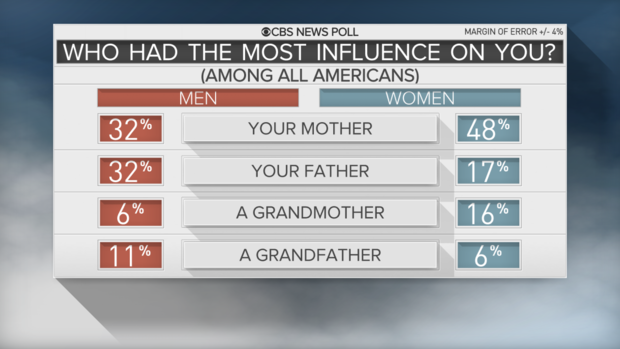
This is particularly true of women. While men are divided between their mother and their father in terms of who had the most influence on them, women are far more likely to say their mother.
There may be some implications for the necktie industry. Americans who say their father had the most influence on them are more likely to have bought him a necktie (45%) than those who were more influenced by their mother (36%). – Fred Backus
——————————————————————————————————————————-
This poll was conducted by telephone May 14-19, 2019 among a random sample of 1,019 adults nationwide. Data collection was conducted on behalf of CBS News by SSRS of Glen Mills, PA. Phone numbers were dialed from samples of both standard land-line and cell phones.
The poll employed a random digit dial methodology. For the landline sample, a respondent was randomly selected from all adults in the household. For the cell sample, interviews were conducted with the person who answered the phone.
Interviews were conducted in English and Spanish using live interviewers. The data have been weighted to reflect U.S. Census figures on demographic variables. The error due to sampling for results based on the entire sample could be plus or minus four percentage points. The error for subgroups may be higher and is available by request. The margin of error includes the effects of standard weighting procedures which enlarge sampling error slightly. This poll release conforms to the Standards of Disclosure of the National Council on Public Polls.
6/12/2019: The Simpson Murders
Today marks 25 years since the murders of Nicole Brown Simpson and Ron Goldman.
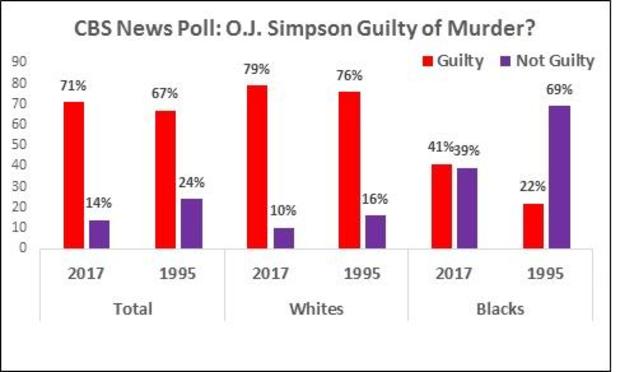
In a CBS News Poll conducted in 2017, as O.J. Simpson was being released from prison for an armed robbery and kidnapping conviction, 71% of Americans said that Simpson was guilty of the 1994 murders of Nicole Brown Simpson and Ron Goldman. This was a slight increase from the 67% who thought so in October 1995, when the jury came back with a not guilty verdict.
A large majority of white Americans has long thought Simpson was guilty of the murders. There has been a shift in the perspective of black Americans, however. While 69% of blacks said that O.J. Simpson was innocent in 1995, black Americans were more divided in their views years later in 2017. Link to full poll. — by Jennifer De Pinto
6/5/19: What We’re Looking At Today
75 Years After D-Day: Today Americans Say World War II Was Worth Fighting, But they Didn’t Always Feel that Way
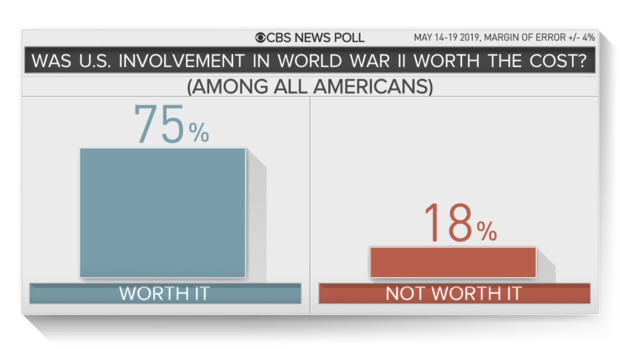
This week commemorates the 75th anniversary of the D-Day invasion of Normandy and the sacrifices made by Americans and its allies during World War II in which over 400,000 Americans lost their lives. Americans today overwhelmingly think U.S. involvement in World War II was worth it, but this wasn’t the case before the war began. A look back at polling conducted by Gallup in the 1930s and 1940s reveals that few Americans were keen on joining the conflict before the attack on Pearl Harbor. But opinions changed once America got involved, and after D-Day most Americans were optimistic that the war would be over in six months or less.
Today, three in four Americans think U.S. involvement in World War II was worth it, a sentiment that cuts across ideological and demographic lines. Majorities of Republicans, Democrats, independents – and Americans of all ages – all think World War II was worth the loss of American life and the other costs involved.
But in a poll conducted by Gallup in October 1939 – just a month after the Nazi invasion of Poland and before the U.S. entered the war – just 3% of Americans thought the U.S. should declare war on Germany. While support for entering the war rose gradually over the next two years, a large majority of Americans remained opposed to U.S. involvement. As late as October 1941 – just two months before the Japanese attack on Pearl Harbor – the percentage of Americans that wanted the U.S. to declare war on Germany was still only 18%.
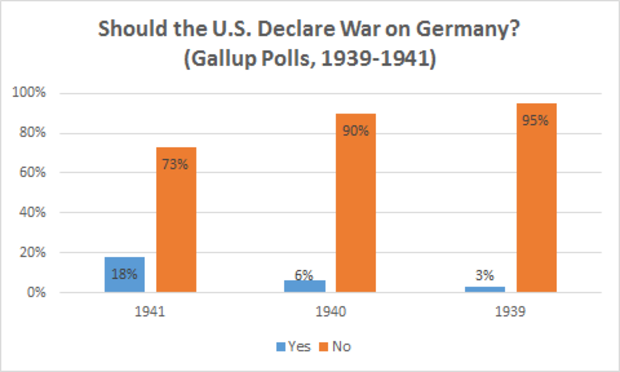
Public opinion shifted once the U.S. committed to the war effort. In February 1944 – a few months before the June 6th D-Day landings in Normandy – just 14% said it was a mistake for the U.S. to enter World War II.
After the Normandy landings on June 6th, Americans were optimistic that the war in Europe would end relatively soon. 64% of Americans thought it would be over within six months, including 18% who thought it would be over by the fall. But it would be another 11 months before the allied forces accepted Germany’s unconditional surrender on May 8th, 1945. – Fred Backus
——————————————————————————————————————————
This poll was conducted by telephone May 14-19, 2019 among a random sample of 1,019 adults nationwide. Data collection was conducted on behalf of CBS News by SSRS of Glen Mills, PA. Phone numbers were dialed from samples of both standard land-line and cell phones.
The poll employed a random digit dial methodology. For the landline sample, a respondent was randomly selected from all adults in the household. For the cell sample, interviews were conducted with the person who answered the phone.
Interviews were conducted in English and Spanish using live interviewers. The data have been weighted to reflect U.S. Census figures on demographic variables. The error due to sampling for results based on the entire sample could be plus or minus four percentage points. The error for subgroups may be higher and is available by request. The margin of error includes the effects of standard weighting procedures which enlarge sampling error slightly. This poll release conforms to the Standards of Disclosure of the National Council on Public Polls
Other sources:
1939 Gallup Poll: Conducted by Gallup Organization, October 20 – October 25, 1939 and based on 1,500 personal interviews.
1940 Gallup Poll: Conducted by Gallup Organization, October 2 – October 7, 1940 and based on 1,500 personal interviews. Sample: National adult. Sample size is approximate.
1941 Gallup Poll: Conducted by Gallup Organization, October 24 – October 29, 1941 and based on 1,500 personal interviews. Sample: National adult. Sample size is approximate.
1944 Gallup Poll: Conducted by Gallup Organization, February 3 – February 9, 1944 and based on 1,500 personal interviews. Sample: National adult. Form K interviewed Feb. 2-8, 1944, Form T Feb 4-9, 1944. Sample size is approximate.
1944 Gallup Poll: Conducted by Gallup Organization, June 22 – June 27, 1944 and based on 1,500 personal interviews. Sample: National adult. Sample size is approximate
5/31/19: What We’re Looking At This Weekend
Where Americans like to go on vacation…and how they like to get there
With Memorial Day behind us, many Americans start looking forward towards summer vacation. But which type of vacation is the most appealing? We asked Americans recently to choose among five options, and the top choice was going to another country, picked by 31%. In second place was going to the beach, though nearly as many picked going to the mountains. 14% said they would just rather stay home. At the bottom of the list was going to a lake at just 12%
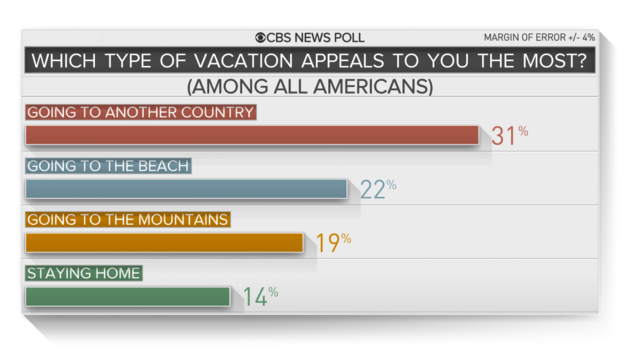
Going to another country may be the top choice overall, but that type of vacation doesn’t appeal to all Americans equally. It’s overwhelmingly the top choice of Democrats, but Republicans and independents are almost as likely to pick going to the beach or the mountains instead.
For those traveling long distances, flying is the most popular way to get to where they are going. Nearly half say it is the mode of transportation that they most prefer, ahead of driving (36%).
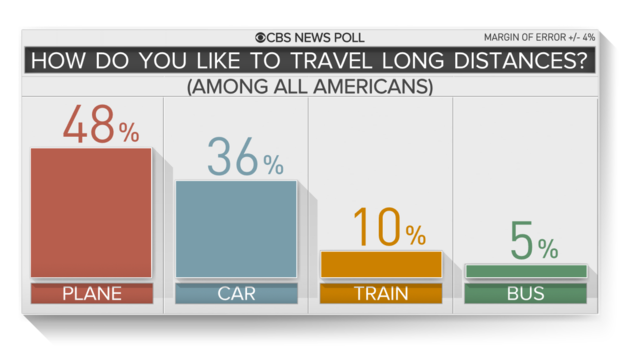
Driving by car is less popular than it was seven years ago when CBS last asked this question. Then nearly as many peoples chose traveling by car (45%) as by plane (46%). – by Fred Backus
——————————————————————————————————————————-
This poll was conducted by telephone May 14-19, 2019 among a random sample of 1,019 adults nationwide. Data collection was conducted on behalf of CBS News by SSRS of Glen Mills, PA. Phone numbers were dialed from samples of both standard land-line and cell phones.
The poll employed a random digit dial methodology. For the landline sample, a respondent was randomly selected from all adults in the household. For the cell sample, interviews were conducted with the person who answered the phone.
Interviews were conducted in English and Spanish using live interviewers. The data have been weighted to reflect U.S. Census figures on demographic variables. The error due to sampling for results based on the entire sample could be plus or minus four percentage points. The error for subgroups may be higher and is available by request. The margin of error includes the effects of standard weighting procedures which enlarge sampling error slightly. This poll release conforms to the Standards of Disclosure of the National Council on Public Polls.
5/30/19: What We’re Looking At Today
Democratic Debate over Investigations – Any Impact on 2020 Candidates?
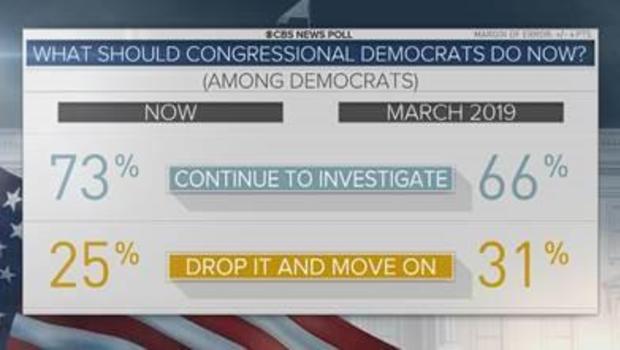
The most recent CBS News poll found that the number of Democrats calling for continued investigations was on the increase. But the 2020 candidates may face a choice in how they approach the idea of pressing on with investigations or even impeachment proceedings. It’s also clear that rank-and-file Democratic voters have other issues on their minds.
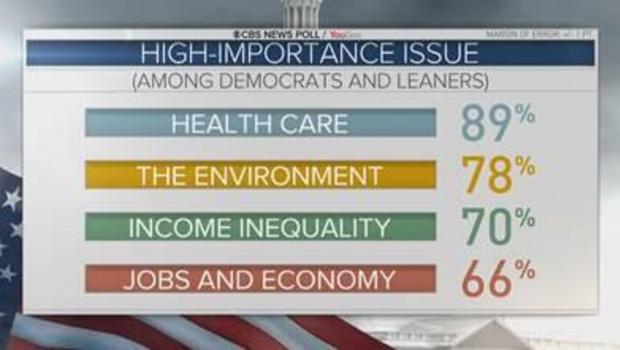
A recent CBS News YouGov survey of Democratic voters shows issues like health care, income inequality, and the environment are all among the top concerns.
More broadly, how the candidates approach this debate over what to do next could speak to approach a campaign, or even governing, in a country that often seems sharply divided by partisanship and ideology. We’ve seen primary contests before in which candidates divided on this topic. Back in 2008 then-candidate Barack Obama in 2008 talked about trying to bridge divides and work across the aisle as he won the Democratic nod; back in 2000 George W. Bush talked about working with Democrats; and even in 2016 then-candidate Trump touted an ability to make deals as a way of getting around the partisanship of Washington. But in 2020 are Democrats this year in that kind of mood? That could be a key item to watch as the campaign goes forward. We asked Democrats about the party’s general approach, whether the party should be spending its energy trying to compromise with Republicans or find ways to defeat Republicans, and six in ten wanted to focus on defeating the other side.
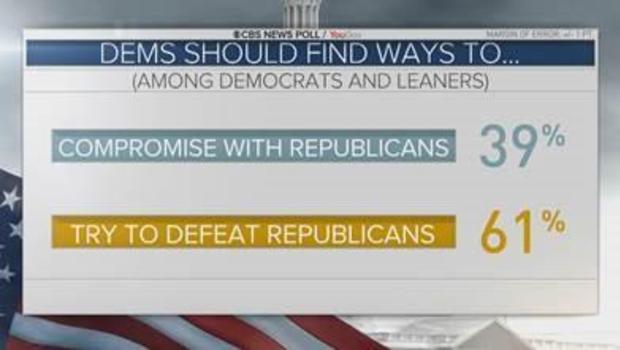
These views were related to ideology, as those who were very liberal picked this while moderates were more inclined to want compromise. And those who had posted on social media were less inclined to want compromise – perhaps a window into the dynamic in which more active voices, even if not as numerous, can shape a debate. And overall there was also more pessimism than optimism that the two sides could get along. – by Anthony Salvanto
5/24/19: What We’re Looking At Today
What does Memorial Day mean to you?
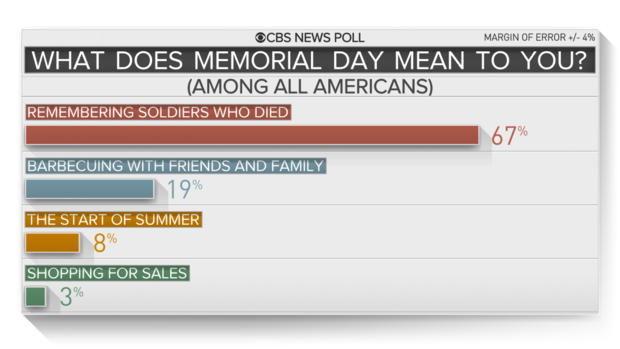
Memorial Day may mean many things to many people, but most Americans haven’t forgotten the original purpose of the holiday. When asked what Memorial Day means to them, 67% of Americans say it is a time to remember those who died while serving in the armed forces. 19% say it means mostly barbecuing with friends and family, 8% think of it as the start of summer, while just 3% think of it as a good time to shop for sales in stores.
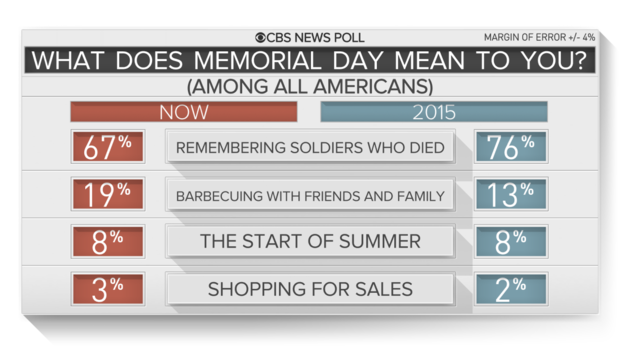
Still, there is evidence that the original intent behind the holiday may be fading for some Americans. When CBS last asked this question in 2015, 76% said it was about remembering soldiers who died – 9 percentage points higher than what is recorded today – while the percentage that says it is about barbecuing has risen six points.
Most Americans of all ages think of Memorial Day as a time to remember fallen soldiers, but younger adults are less likely to do so than older ones. While 81% of Americans 65 and older say Memorial Day is about remembering soldiers who have died, this drops to 57% of Americans under 45. More than a quarter in this age group say Memorial Day means barbecuing with friends and family. – by Fred Backus
——————————————————————————————————————————-
This poll was conducted by telephone May 14-19, 2019 among a random sample of 1,019 adults nationwide. Data collection was conducted on behalf of CBS News by SSRS of Glen Mills, PA. Phone numbers were dialed from samples of both standard land-line and cell phones.
The poll employed a random digit dial methodology. For the landline sample, a respondent was randomly selected from all adults in the household. For the cell sample, interviews were conducted with the person who answered the phone.
Interviews were conducted in English and Spanish using live interviewers. The data have been weighted to reflect U.S. Census figures on demographic variables. The error due to sampling for results based on the entire sample could be plus or minus four percentage points. The error for subgroups may be higher and is available by request. The margin of error includes the effects of standard weighting procedures which enlarge sampling error slightly. This poll release conforms to the Standards of Disclosure of the National Council on Public Polls.
Pew Report on News Photos on Facebook
A new Pew Research Center study finds a big gender imbalance in images accompanying news stories posted on Facebook. Over four in ten U.S. adults get news from Facebook, making it the most commonly used social media site for news. Researchers applied a method called machine vision to analyze over 22,000 images with people in them. Across images, men appeared twice as often as women, and more than half of images showed men exclusively. – by Kabir Khanna
5/23/19: What We’re Looking At Today
What does the term “socialism” mean to Democrats, anyway?
In September 1949 during the early years of the Cold War, the Gallup poll asked, “we hear a lot about ‘socialism’ these days. Will you tell me what your understanding of the term ‘socialism’ is?” The bulk of the answers, as the poll categorized them, described government control of things, ownership of utilities, and “state control of business.” A third didn’t have an answer. When socialism was described for respondents as government running industries and also offering “services like medical and dental care.” 49% felt the U.S. should move more in that direction. In June of 1965, Gallup asked Americans to describe the U.S. economic system. 37% said “capitalism” and 31% picked “moderate socialism.”
Were you to ask people about their own finances they could explain things quite precisely, as you’d expect. Ask about larger economic ideas and theories like “capitalism,” or “socialism,” for instance, and things get more murky: these can be abstractions, and meanings differ even among experts. But terms like “socialism” have long been part of public discourse just the same, so pollsters rightly wonder just how Americans interpret it, and how to measure it in the first place.
It’s become especially important now as “socialism” is heard or implied a lot in the 2020 campaign though it still isn’t always clear, when people reference it, that they all agree on what it means. The President warns Democrats might impose it. Democrats look to define the term for themselves.
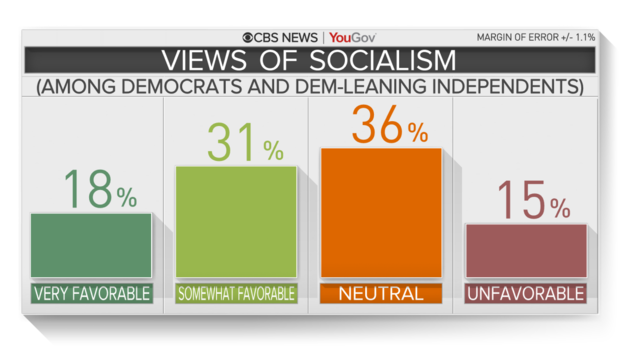
In our own recent CBS News/YouGov study, 18% of Democrats and Democratic-leaning independents said they had a very favorable view of socialism and another third, 31%, said they had a somewhat favorable view. Another third were neutral. But just what is it they were evaluating in the first place?
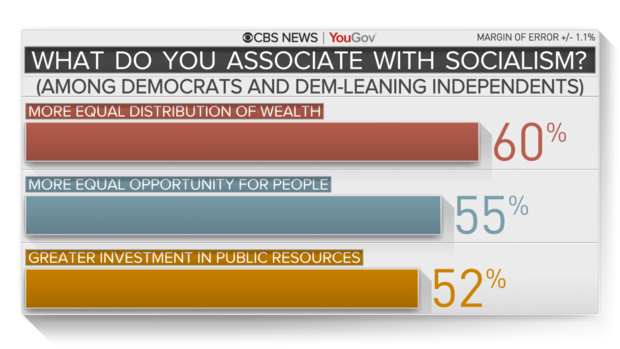
We gave a large sample of voters a list of items and asked whether they thought each of the ideas aptly described “socialism.” People could pick as many as they wanted.
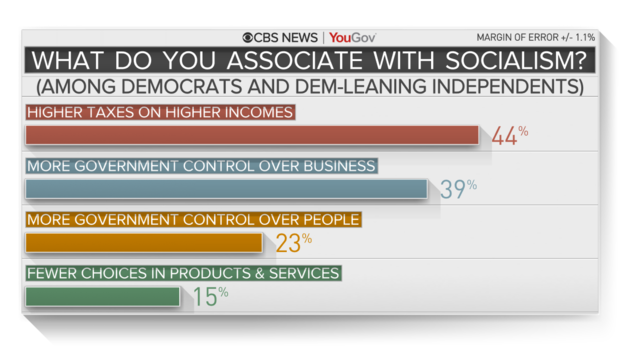
The most-cited answer of the choices we offered saw 60 percent of Democrats associating socialism with “more equal distribution of wealth and money” and closely followed by 55 percent who picked “More equal opportunity for people.” Far fewer Democrats selected items with potentially more negative-sounding implications like “Fewer choices in products and services” picked by just 15%, and “More government control over people” at 23%.
In all, many Democrats picked associations that had more to do with economic outcomes they’d probably like (things like equality) and less with things that sounded like limitations or potential ill-effects.
There are some age differences among Democrats’ views on socialism overall. In no age group does a majority hold a very favorable view of socialism. However, younger Democrats under 30 are about twice as likely to hold a very favorable view (23%) than those over 65 (12%). But there is not much difference by income or financial situation: higher income Democrats view socialism in much the same ways as lower income Democrats do, though those more confident in their ability to pay bills are more likely to associate it with higher taxes. Ideology appears to be more related to views, as those who call themselves liberal are more likely to hold favorable views than moderates. That may suggest that views on broader economic systems stem from ways in which people view the world, or the world as they’d like it to be, rather than just through the lens of their own pocketbooks. – by Anthony Salvanto
This poll analysis is drawn from a 2019 CBS News/YouGov survey using a nationally representative sample of 24,850 U.S. registered voters interviewed online between April 25 – May 6, 2019. This sample was weighted according to gender, age, race, and education based on the American Community Survey, conducted by the U.S. Bureau of the Census, as well as 2016 Presidential vote. This analysis covers 12,000 registered voters who are Democrats and Democratic-leaning Independents. MOE 1.1%
Other sources:
1949 Gallup Poll: Conducted by Gallup Organization, September 3 – September 8, 1949 and based on 2,896 face-to-face interviews. Sample: National adult.
1965 Gallup Poll: Conducted by Gallup Organization, June 4 – June 9, 1965 and based on 1,648 personal interviews. Sample: Sample: National adult.
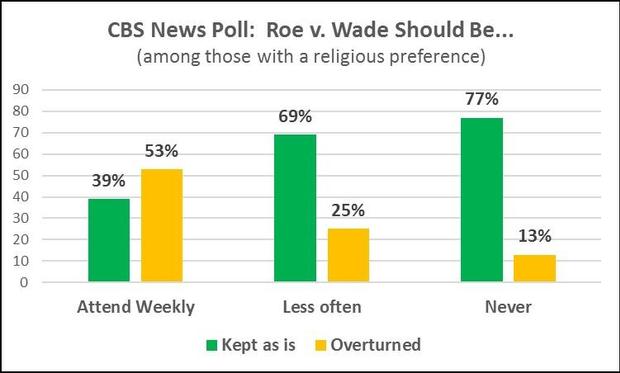
Roe v. Wade and Religion
Looking deeper into our CBS News Poll out earlier this week, views on what the U.S. Supreme Court should do about Roe v. Wade differ little by religious preference. Majorities of Protestants, Catholics, and the group that identify with other religions would like to see the 1973 ruling stand.
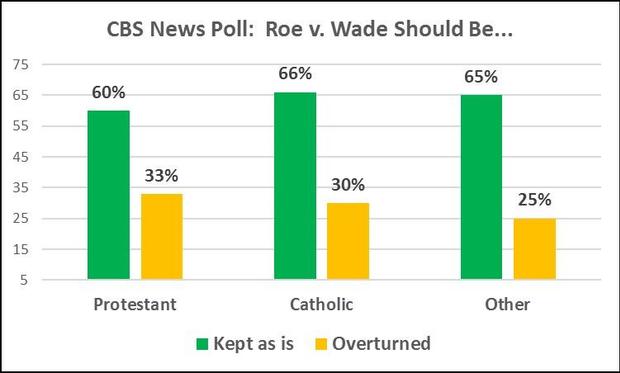
It’s when you look at how frequent those who have a religious preference attend religious services — that’s where there are differences. More than half of those who attend religious services the most often – at least weekly – would like to see Roe v. Wade overturned. However, large majorities of Americans who may identify with a particular religion but attend services less often or never think Roe should be kept as it. – by Jennifer De Pinto
5/17/19: What we found interesting this week
Americans Want China to Change Policies; Wary of Short-Term Tariff Impact
In views on trade and tariffs with China, most Americans applaud the goals but express some wariness about the tactics – at least in the short run, according to the latest CBS News Poll. Two-thirds of Americans say they’d be unwilling to pay more for goods impacted by any tariffs while the U.S. tries to renegotiate trade deals. Six in ten Republicans are willing to pay more, which sets them apart from most Democrats and independents, most of whom are not willing.
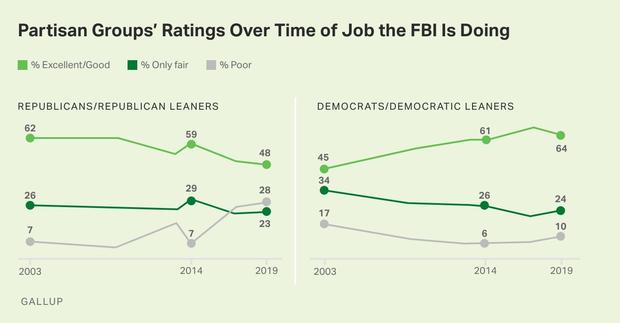
Partisan Divide on Ratings of the FBI, People Love the Postal Service
Most Americans (57%) rate the job the FBI is doing as excellent or good, according to a recent Gallup Poll. Overall, this rating has held fairly steady, but partisans’ views have changed some over time. Democrats’ opinions of the FBI have grown more positive, while Republicans have become more negative. It’s the U.S. Postal Service that gets the highest marks from the public of any agency asked about in the Gallup Poll. 74% of Americans say it is doing an excellent or good job. Majorities of Democrats and Republicans agree on that. Chart from Gallup below and more from the poll here.
Trump Support and the Tea Party
Former supporters of the Tea Party are some of Donald Trump’s strongest Republican backers, according to a new analysis from the Pew Research Center. The analysis is based on panel surveys conducted from 2014 through 2018. “In February 2018, those who had been Republican tea party supporters gave Trump an average rating of 78 on a 0-100 ‘feeling thermometer,’ while Trump’s rating averaged 59 degrees among those Republicans who had no opinion of the tea party and was a much chillier 53 degrees among those who disagreed with the tea party.”
Public Divided on Fairness of College Admission Process
According to polling recently conducted by the AP-NORC center, 38% of Americans consider the college admissions process to be fair, 36% call it is unfair, and a quarter say it is neither fair nor unfair.Most say academic achievements like high school grades and standardized test scores are and should be the most important factors in determining admission. Just 11% think legacy status should be given much consideration.
5/16/19 Notes on abortion views
Recent legislation in states restricting abortions has put the topic back into the headlines. As has been the case for many years in CBS News polling, today a large majority of voters believes abortion should at least be available, though many of them say they’d like to see it under stricter limits than it is currently. One in five voters says abortion should not be permitted.
| Abortion Should Be… |
| (Among registered voters) |
| Be generally available to those who want it 45% |
| Be available but under stricter limits than it is now 33% |
| Not be permitted 22% |
| CBS News/YouGov survey of registered voters April 25 – May 6, 2019. MOE 1% |
In the 2018 midterms, exit polls asked voters what the Supreme Court should do with Roe v Wade. Two-thirds, 66%, said the Supreme Court should let it stand one-quarter, 25%, said the Court ought to overturn it. (CBS News Exit Poll Nov 2018 MOE 2%) — by Anthony Salvanto
5/10/19: What we found interesting this week
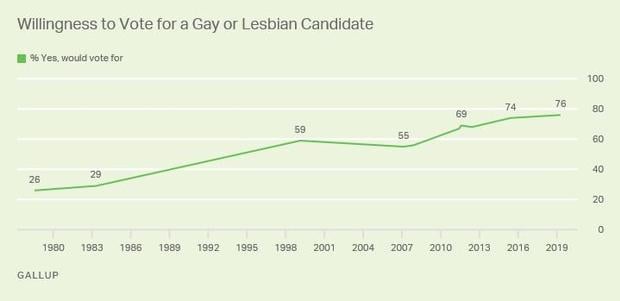
Americans more willing to vote for a gay candidate for President, but a socialist not so much
Seventy-six percent of Americans say they would vote for a qualified gay or lesbian candidate for president, according to a Gallup Poll out this week. The figure marks a new high in Gallup polling. The survey asked about 12 hypothetical candidates.
More Americans are also open to candidates of different religious backgrounds. “Eighty percent of U.S. adults would vote for an evangelical Christian for president — up from 73 percent in 2015. Meanwhile, the percentage of Americans who would vote for a Muslim has grown from 58 percent in 2012 to 66 percent today,” according to the poll.
Six in 10 would vote for an atheist, a new high. Just 47 percent say would vote for a socialist for president, the lowest for any attribute asked about in the poll. Read the full poll results here and chart from Gallup below.
More on Socialism…
According to a recent Monmouth University Poll, most Republicans hold a negative view of socialism, while most Democrats have a neutral opinion. Looking behind these broader views, a majority of Republicans say the phrase “it takes away too many individual rights” describes their view of socialism either a great deal (64 percent) or somewhat (17 percent). Fewer Democrats hold this view. For most of them, the descriptor of socialism as “a way to make things fairer for working people” matches their view a great deal (25 percent) or somewhat (51 percent).
The poll also found most Americans favor creating a universal health care system and when asked how they viewed that policy, far more called it socialist (37 percent) than capitalist (4 percent), but most described it as neither (53 percent). More from the poll here.
Most Obama-Trump voters still view the President favorably, but fewer than in 2016
According to a survey conducted by the Voter Study Group, 66% of Obama-Trump voters have a favorable opinion of President Trump, although this is lower than the 85% of this group who viewed him favorably in 2016, shortly after he was elected president. Overall, President Trump’s favorability ratings have held steady. Eight-five percent of Americans have not changed their minds when it comes to the President’s favorable ratings in the last two years, according to the survey. Read more here.
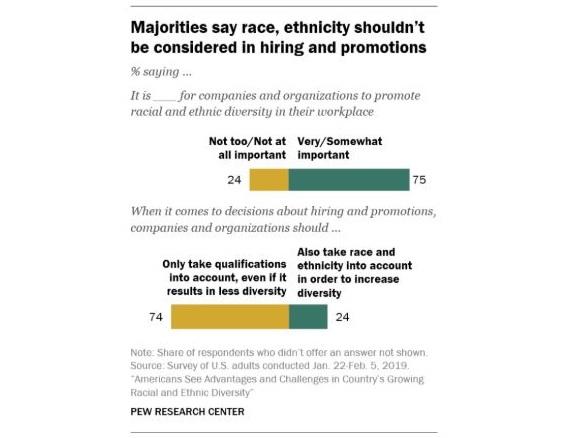
Most Value Workplace Diversity, But Few Think Race Should be a Consideration in Hiring
“Americans have a complicated, even contradictory, set of views about the impact of diversity and the best way to achieve it”, according to a recent Pew Research Center Survey. Three in four Americans say it’s very or somewhat important for companies to promote racial and ethnic diversity in the workplace, but most say only qualifications should be taken into account when making hiring and promotion decisions; just a quarter think race or ethnicity should be taken into account.
“The view that employers should only take a person’s qualifications into account is widespread among whites (78 percent) and Hispanics (69 percent); about half of blacks (54 percent) share this view.” Table from Pew Research below and more from the survey here.

Leave a Reply